Turn insights into action
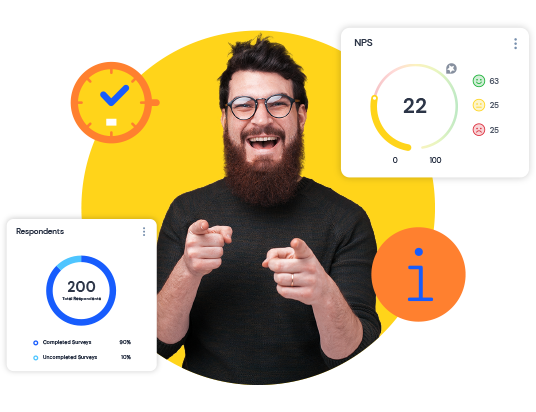
Create real-time, beautiful, shareable reports and dashboards with built-in text-analysis to get actionable insights.
Try it yourselfGet ready to wow your colleagues!
You have total control over every aspect of your reports, from the styling to which questions and chart types are used. You can include your meta-data and add dynamic content that changes depending on the results.
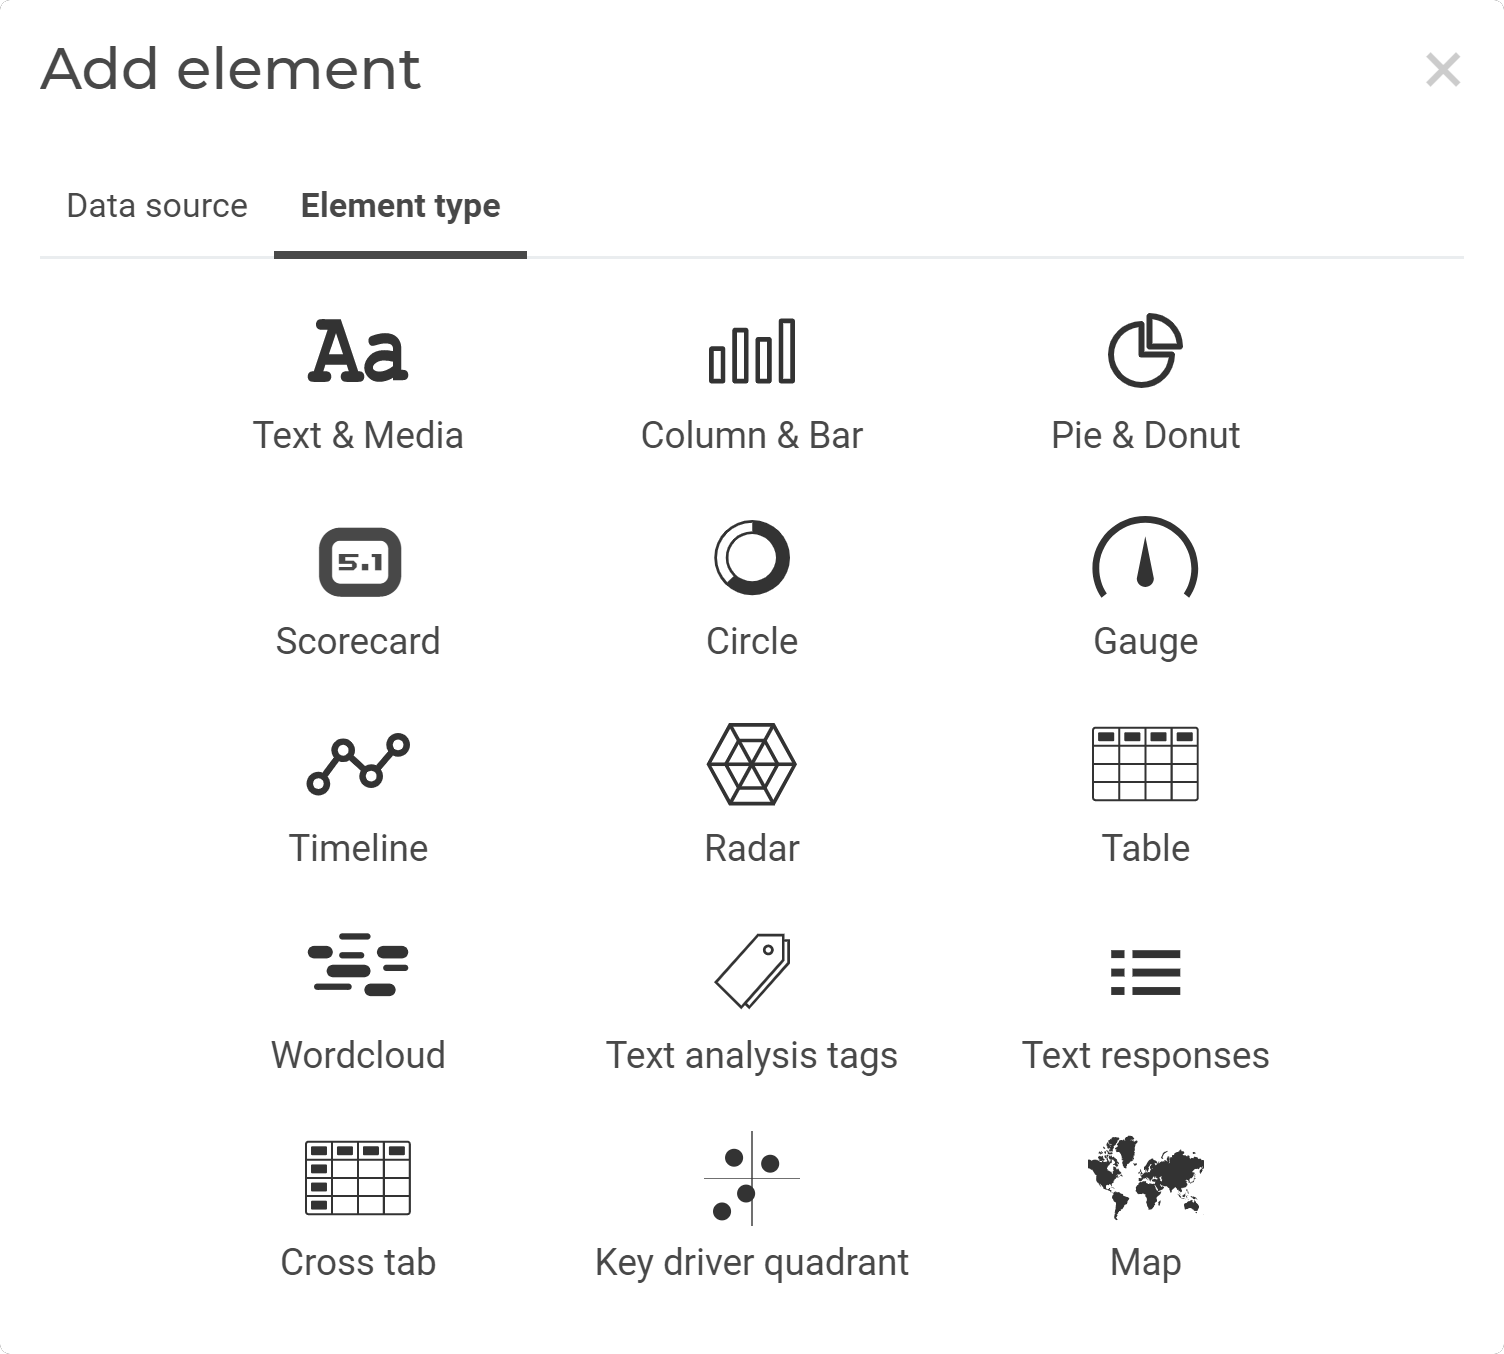

Reports & dashboards
Build real-time filtered reports & dashboards and share them with others.
Text & sentiment analysis
Built-in text & sentiment analysis and automatic text-mining lets you get the most out of your open answers.
Download in various formats
Get your results and reports in various native formats such as PDF, Excel, SPSS, CSV, etc.
Filters
You can filter on answers, operational data that you passed to the survey or on respondent metadata that the system automatically captures. You can save the filters, so that you don’t need to rebuild them from scratch every time. You can also offer them as pre-built filters in your shared reports.
- Entire report
- Shared report
- Individual element
- Ad-Hoc in viewer
- Combination
Benchmarks
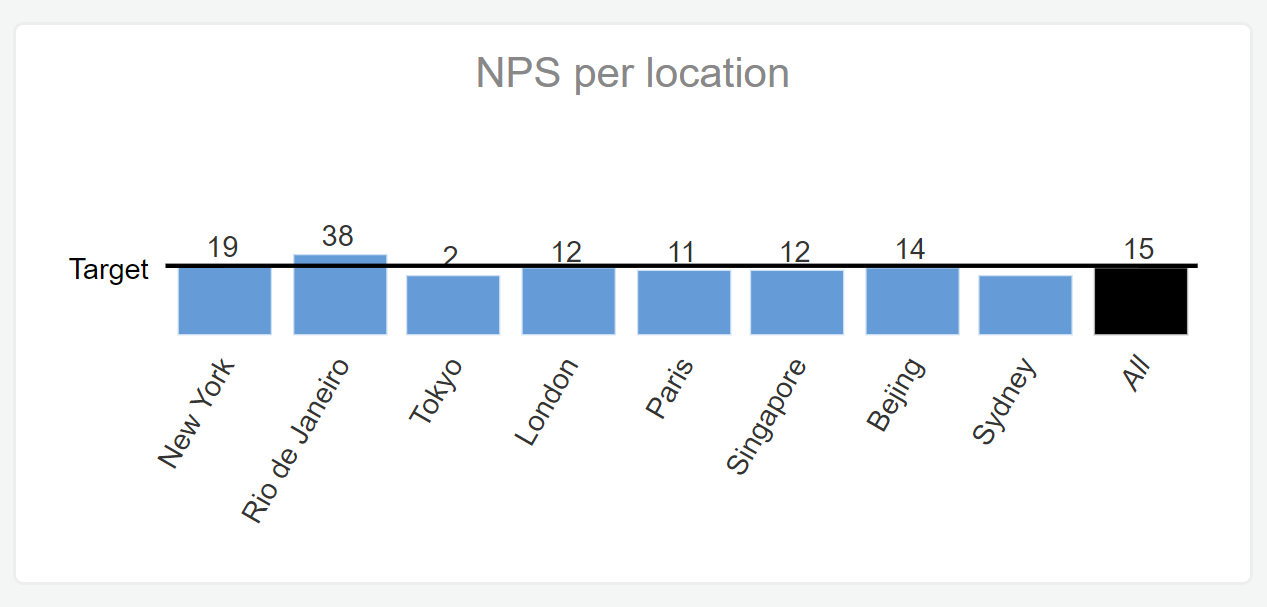
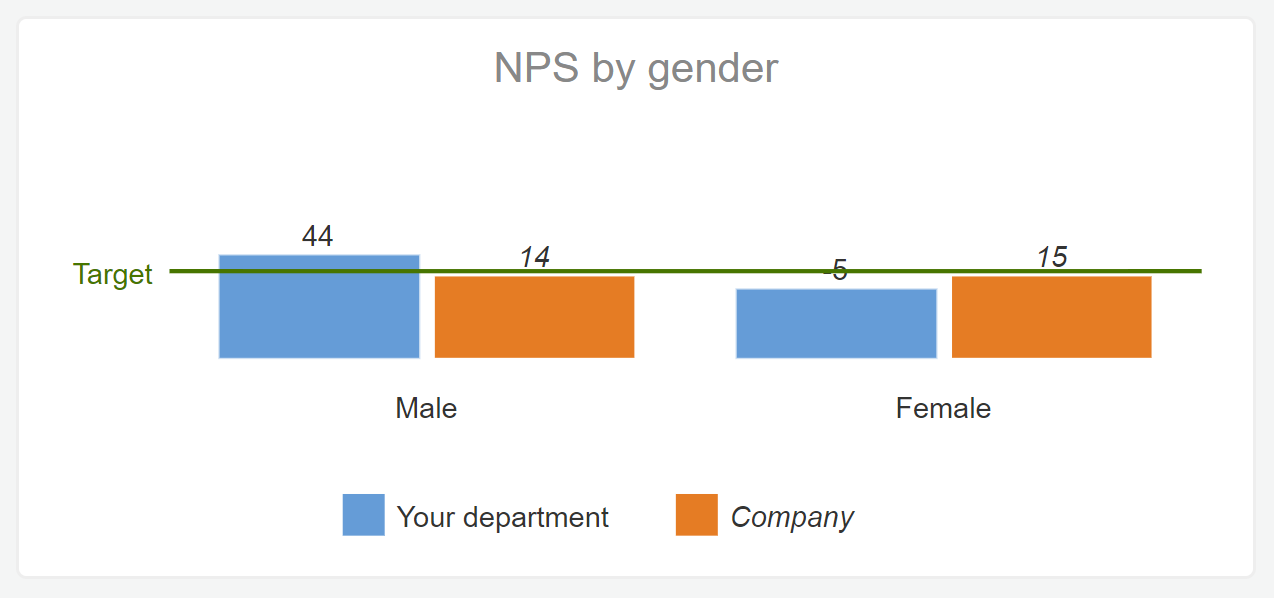
You can add a benchmark to a chart to show a global score. For instance, show the combined NPS score for all stores next to the breakout of the individual store scores, or show the NPS score from last month vs this month.
- Dynamic
- Fixed
- Own filters
- Column
- Line
- Arrow
Break-outs
This is one of the most awesome features of the report builder. It lets you take a score, like e.g. NPS, and ‘break it out‘ based on another question or custom field. For example, compare the NPS scores for different store locations or customer types. When you add a new store location to the survey, it will automatically be added to the breakout in your report!
Start gathering insights today
Sign Up Free
Merging
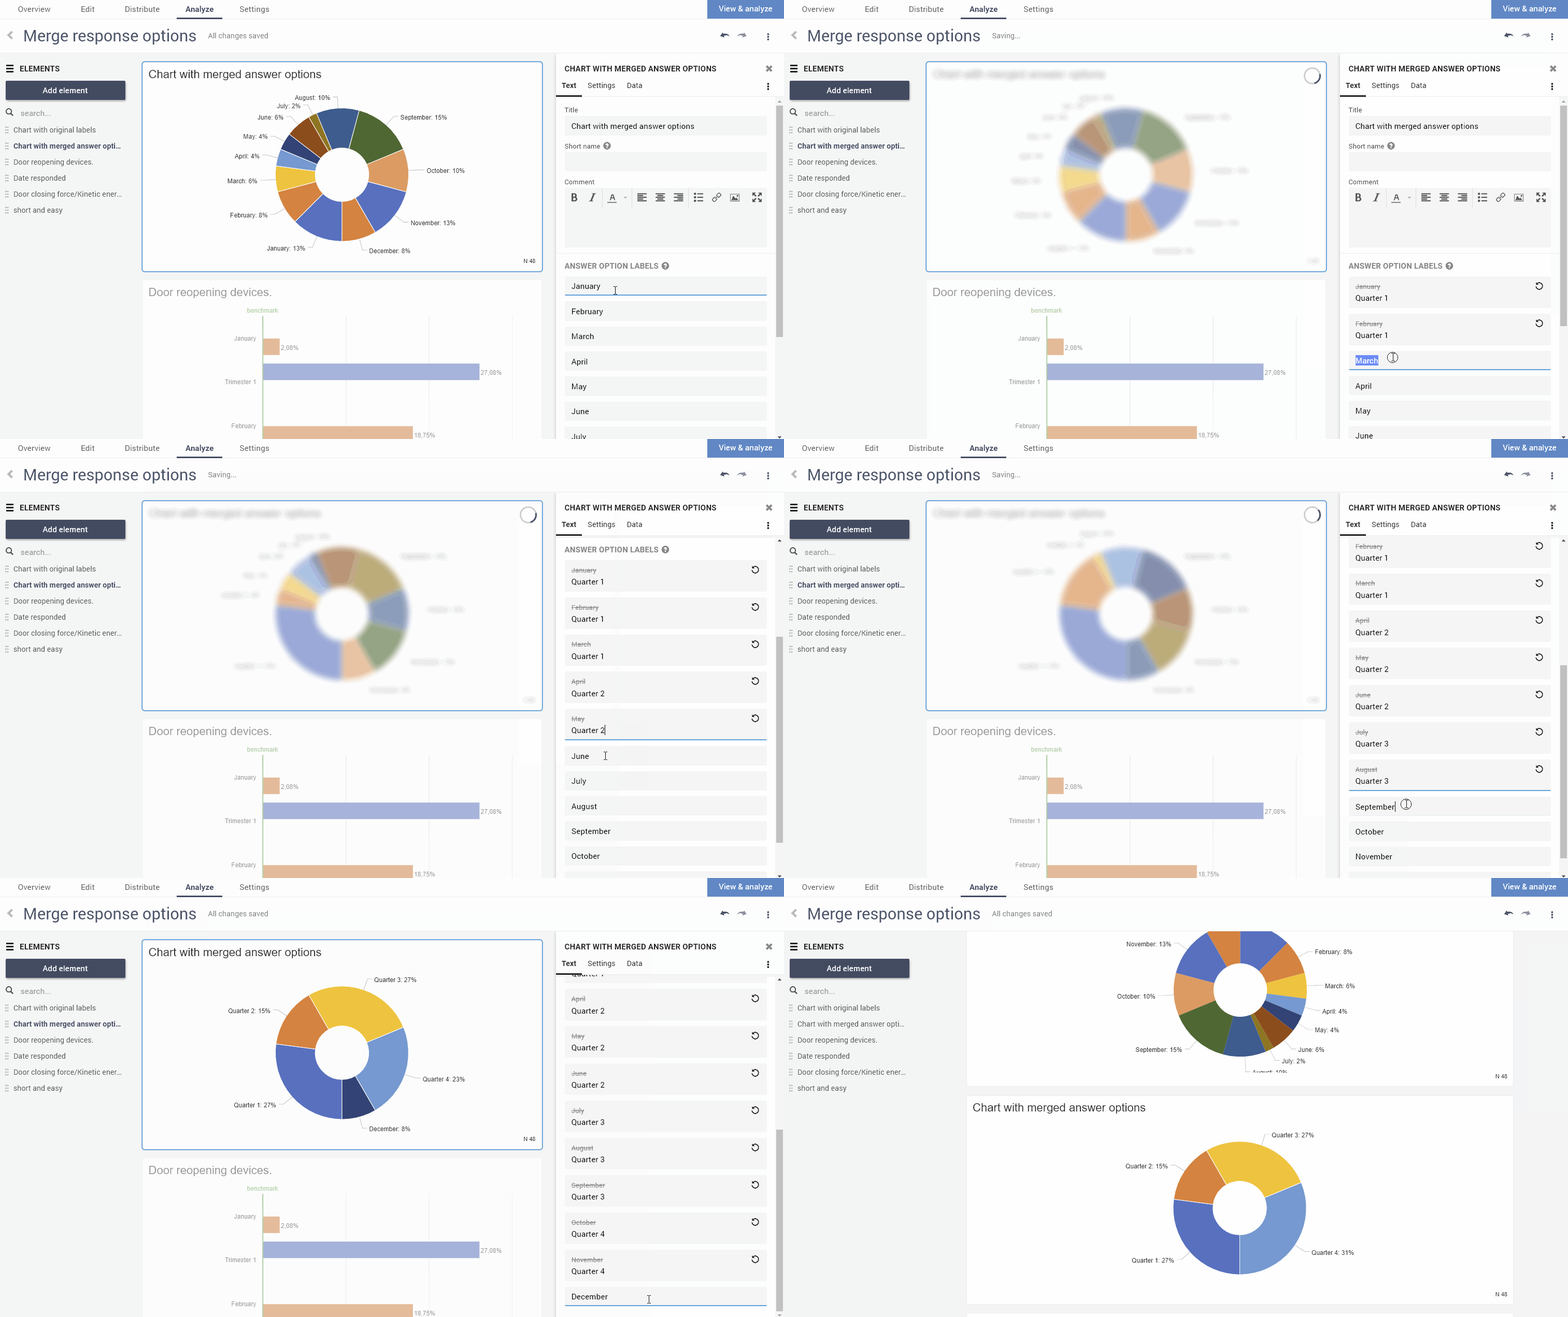
You can combine and merge answer choices, presenting them as one in a report element. To do so, simply give the answer options you want to group together, the exact same label. This will combine the results of those answer options and show them together under one unified label. This does not alter the underlying data or survey question.
Sharing
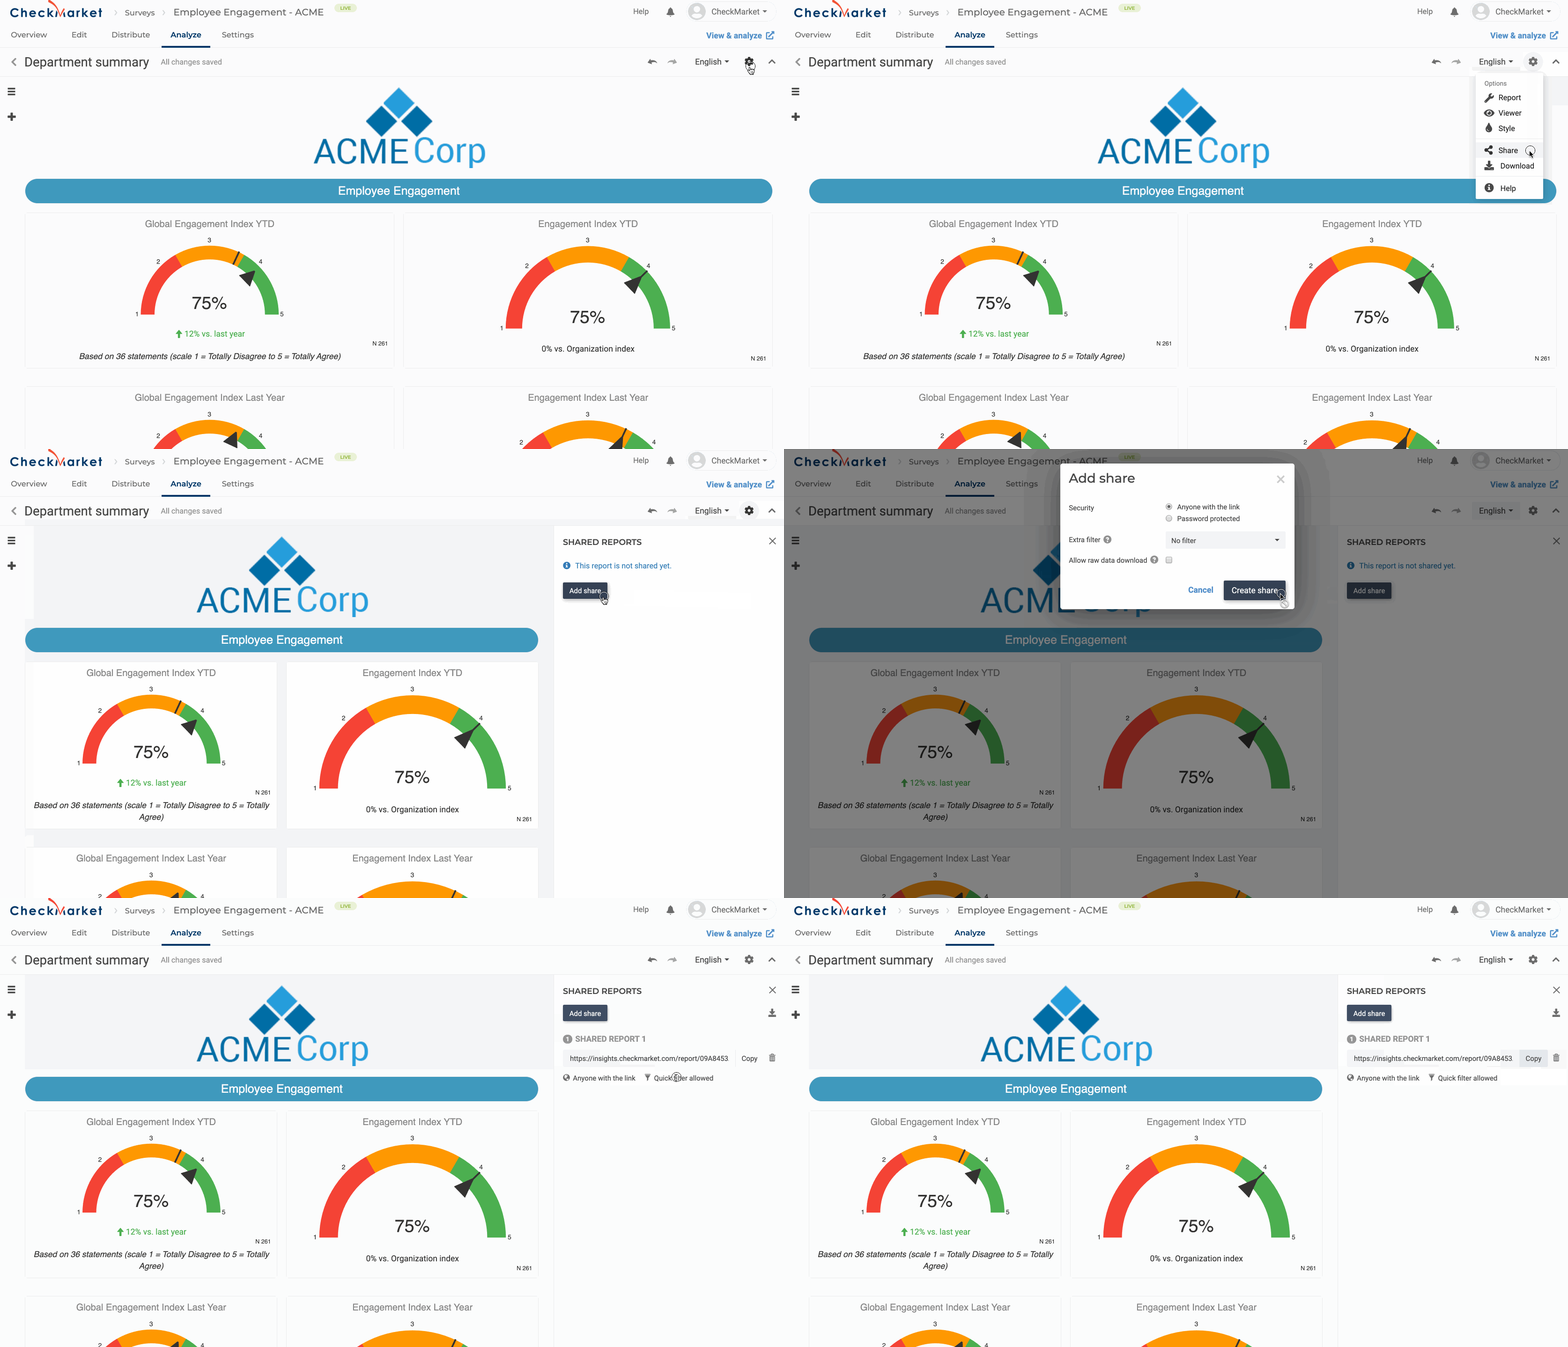
After you are done building an insightful report, share it with others. Create different share links, each with different filters, depending on what you want viewers to see.
That means if you want to have a report for each department or each region of your organization, you do not need to create 10 different reports. Instead, you build one report and then create 10 shares with each share filtered to only show the data for a region or department.
When you later decide to make a small change to the report, you only have to do it once and everyone will see the change.
Dynamic text
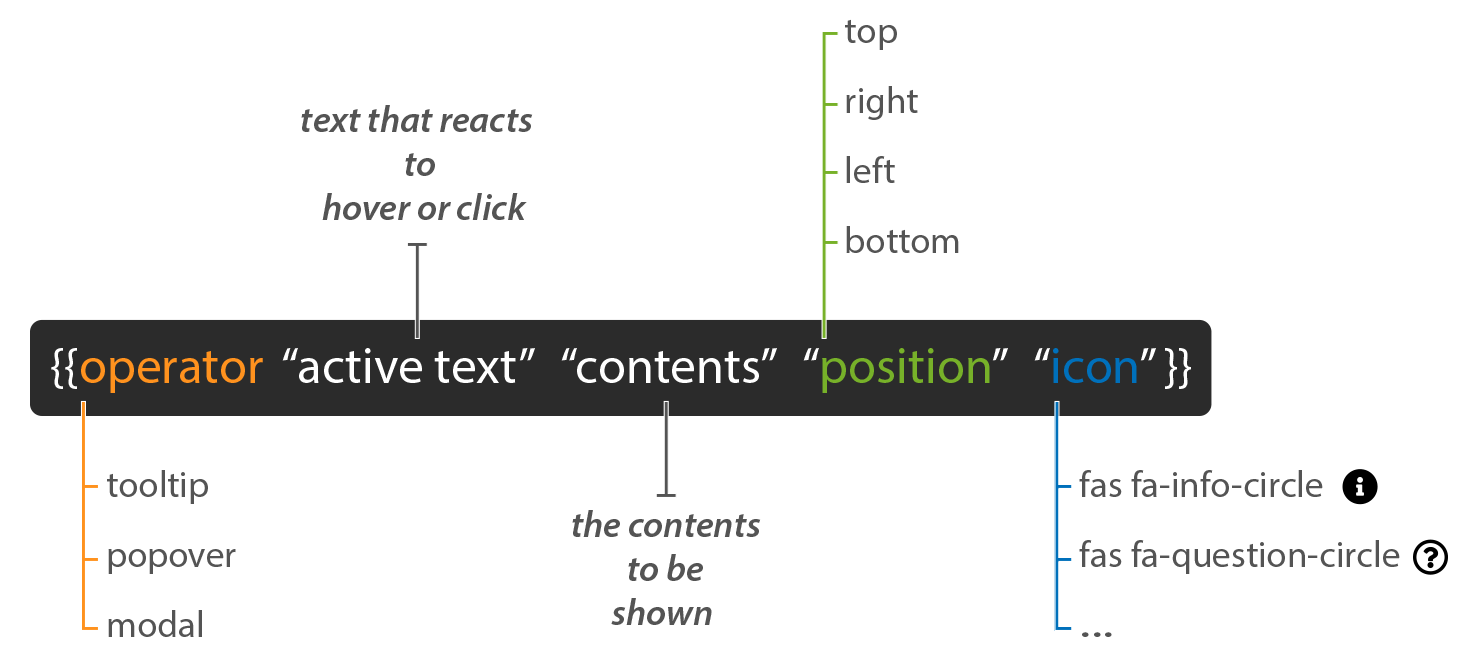
CheckMarket offers a powerful scripting language to enhance your reports.
At its most advanced, our scripting language gives you tremendous freedom to use complex logic to make calculations, show or hide certain blocks of texts or images and much more. For instance if the NPS from a region is less than the benchmark of the whole group, show them a message with action points, automatically.
Text analysis
Use tags to quickly group responses into categories. Apply sentiment (negative, neutral or positive) to identify the underlying feeling.
Beautiful and clear charts show you how the categories stack up. Since open text analysis integrated in our standard reports, you can, for example, click on a category or sentiment to filter and see what impact it has on your satisfaction score. Tagging even works across multiple languages!
Activate automatic tagging of survey responses as they come in! This is not a separate product, it is built into CheckMarket and included in our different plans at no extra cost!
Geo-location
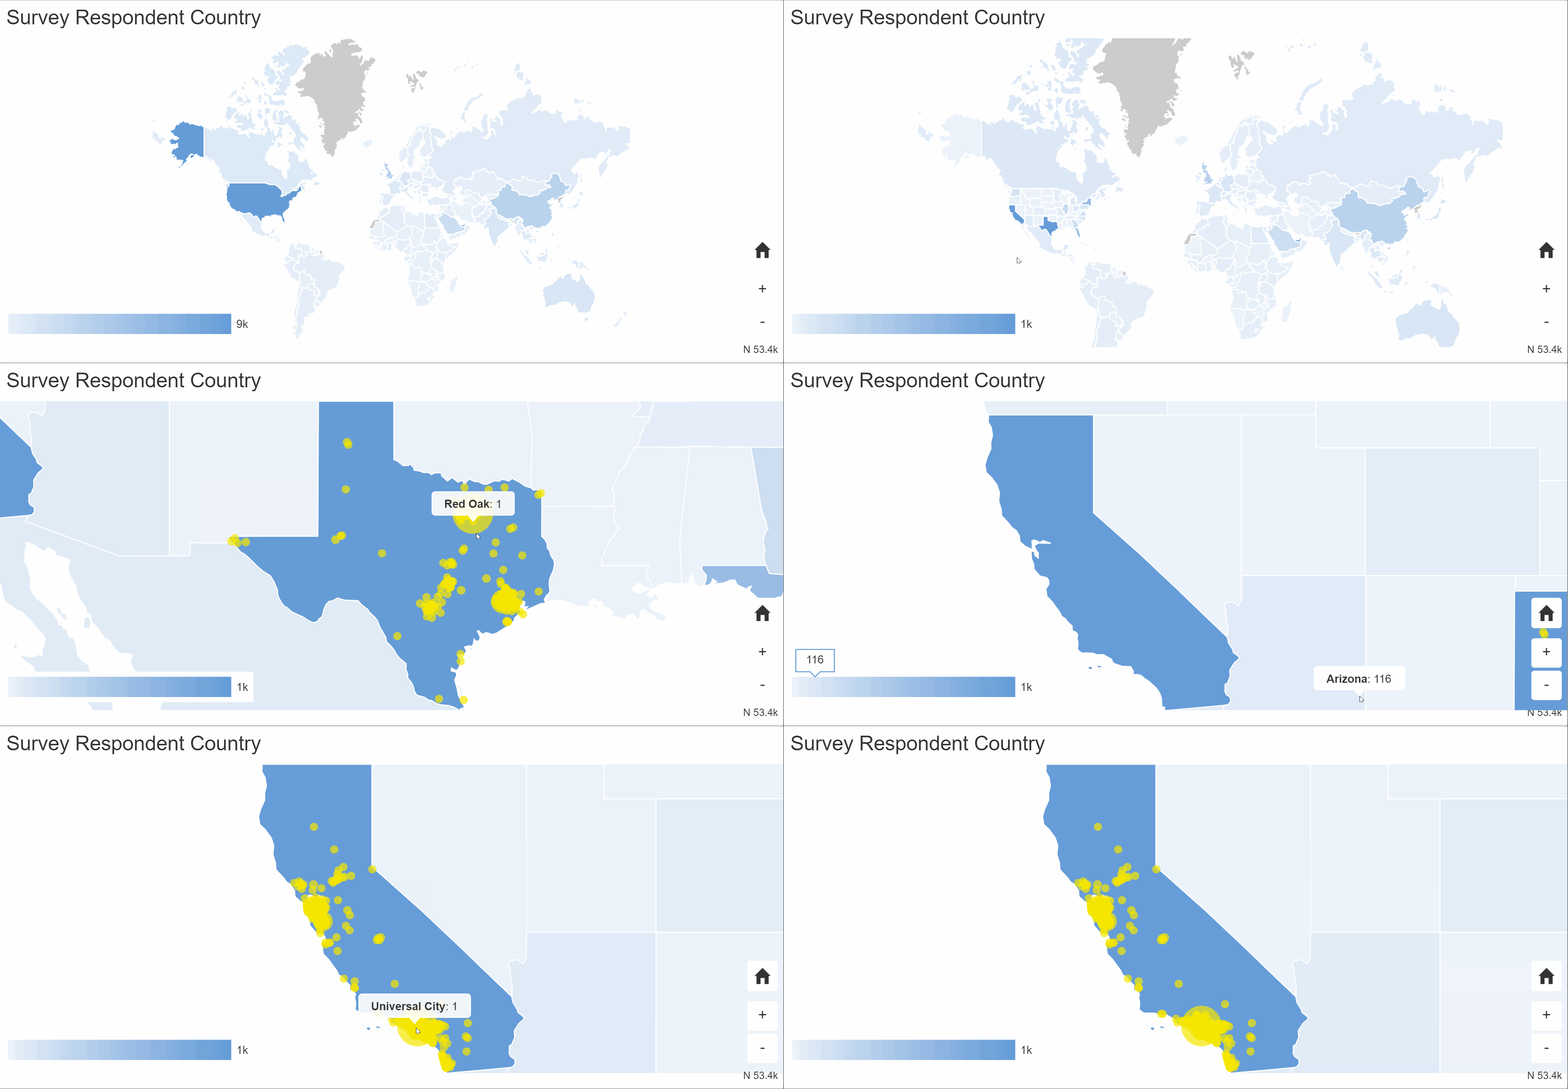
See and filter on the location of your survey respondents. This report elements can start at any level, World, Country, State or province! Change the colors to match your brand.
