The maximum difference scaling (MaxDiff) feature in CheckMarket allows you to measure the relative importance or relative preference of certain product attributes based on respondent answers. Utilizing MaxDiff is recommended in situations when you would like respondents to prioritize and quantify the importance or preference for items on a list. MaxDiff places list items into subsets and asks respondents to choose the least and most important items for each subset and can include either text or images as choices. The following example shows text options:

Creating a MaxDiff survey
To create a survey that includes the MaxDiff feature, complete the following steps:
1. Create a survey and add a question in the survey editor.
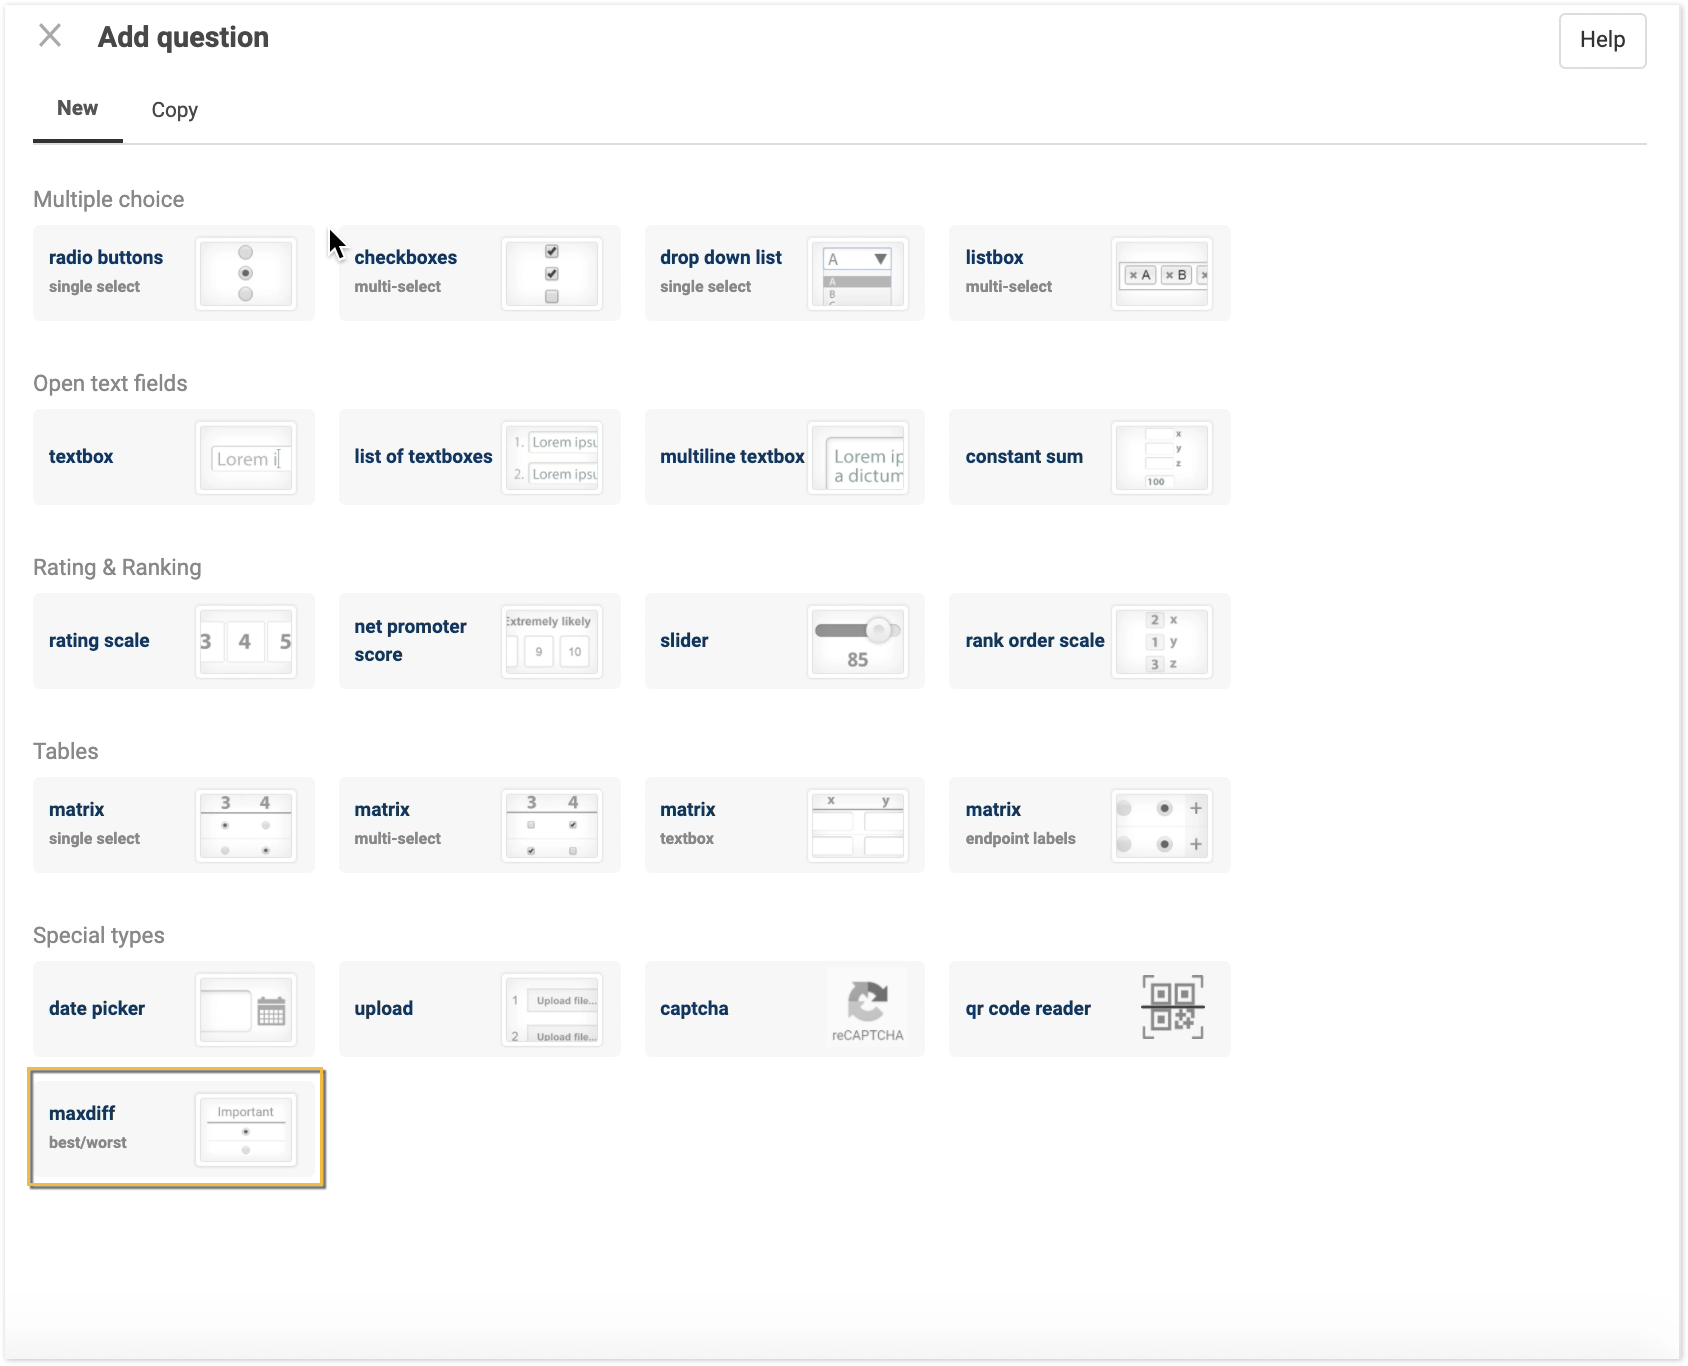
2. In the Add question details pane, select maxdiff located under Special types.
3. On the Question tab, enter the question that you want respondents to answer.
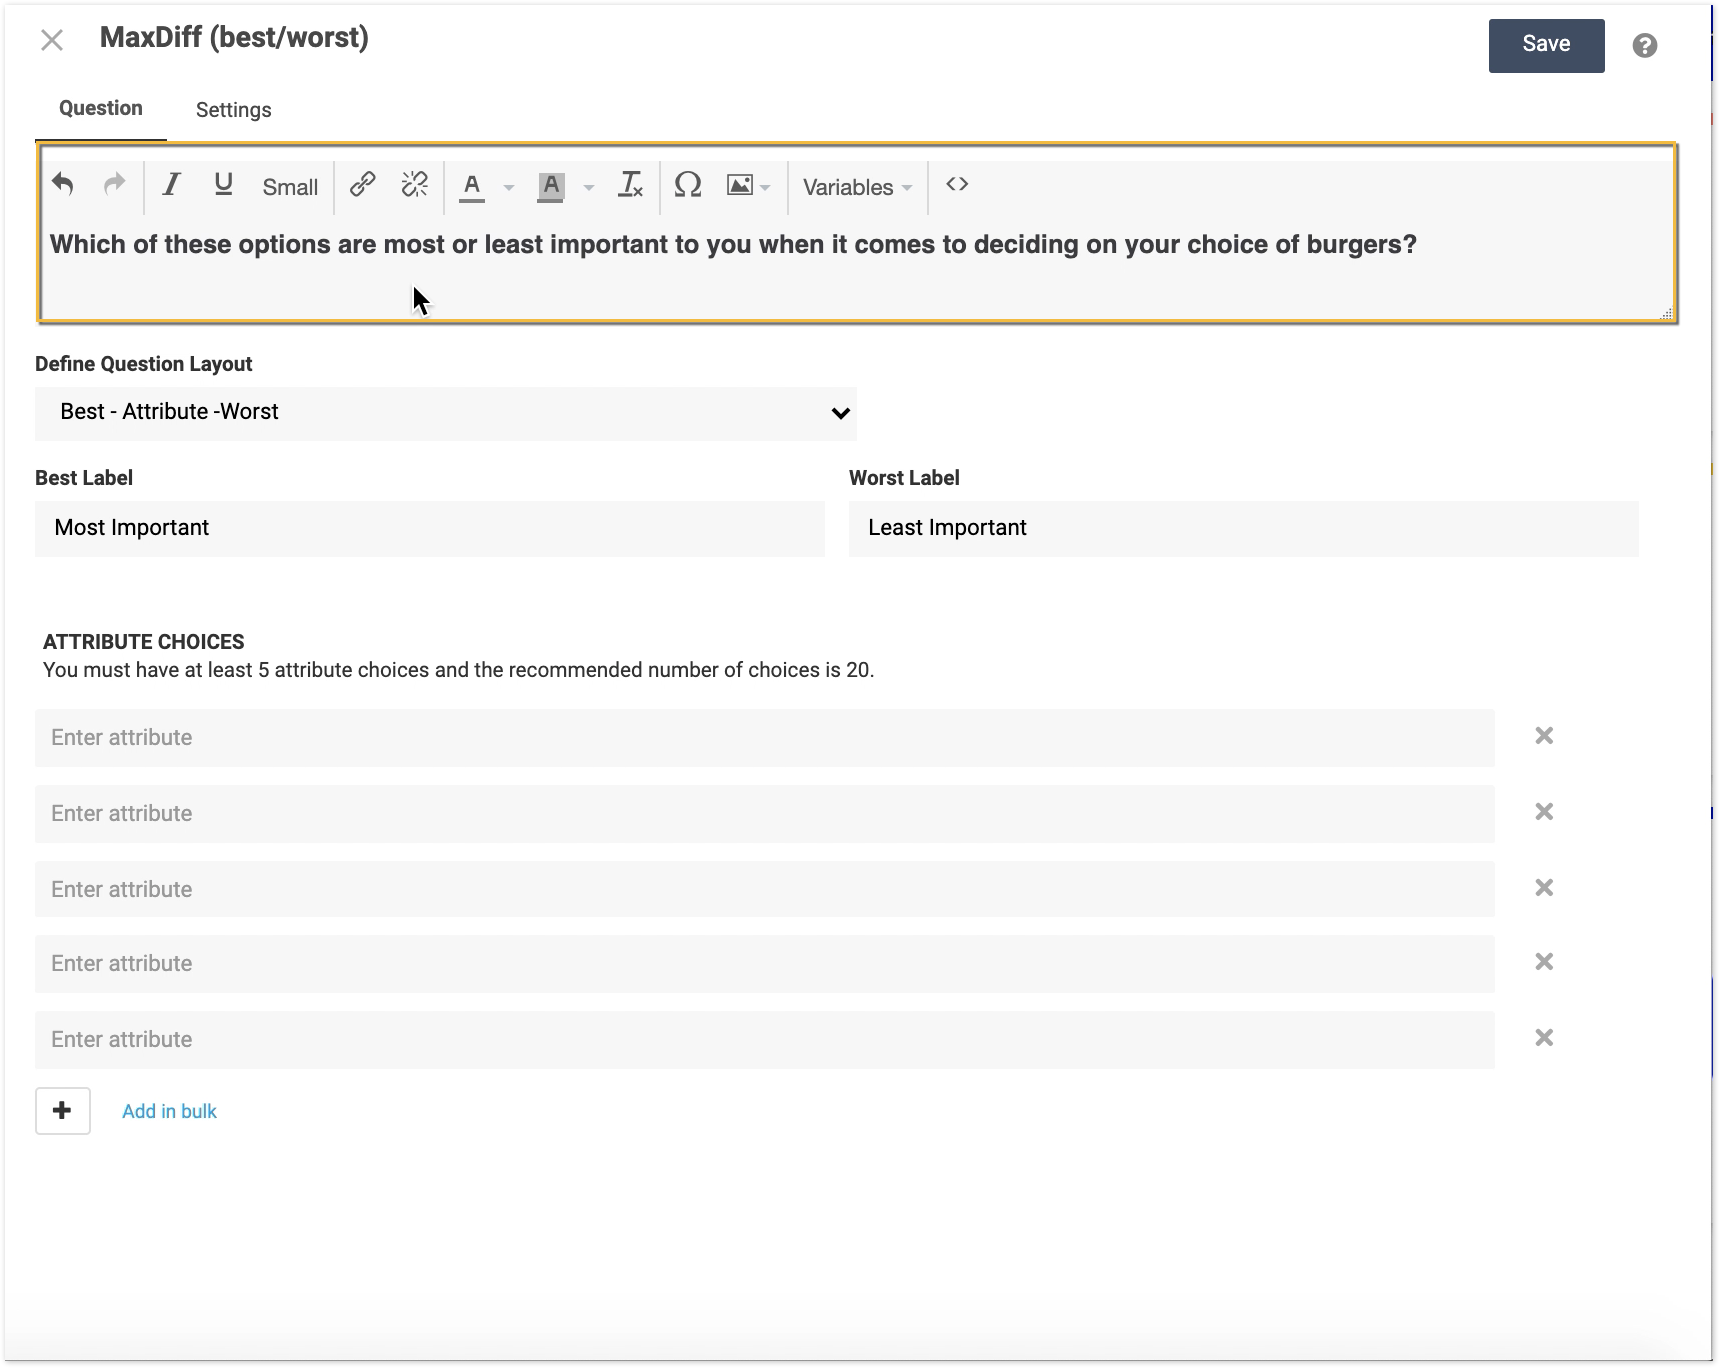
4. Select a question type from the Define Question Layout dropdown. The default selection Best – Attribute – Worst presents check boxes for favorable options on the left, attribute names in the middle, and least favorable options on the right. Customize the labels for attribute choices using the Best Label and Worst Label fields.

5. In the Attributes section, enter the complete list of options that respondents will see.
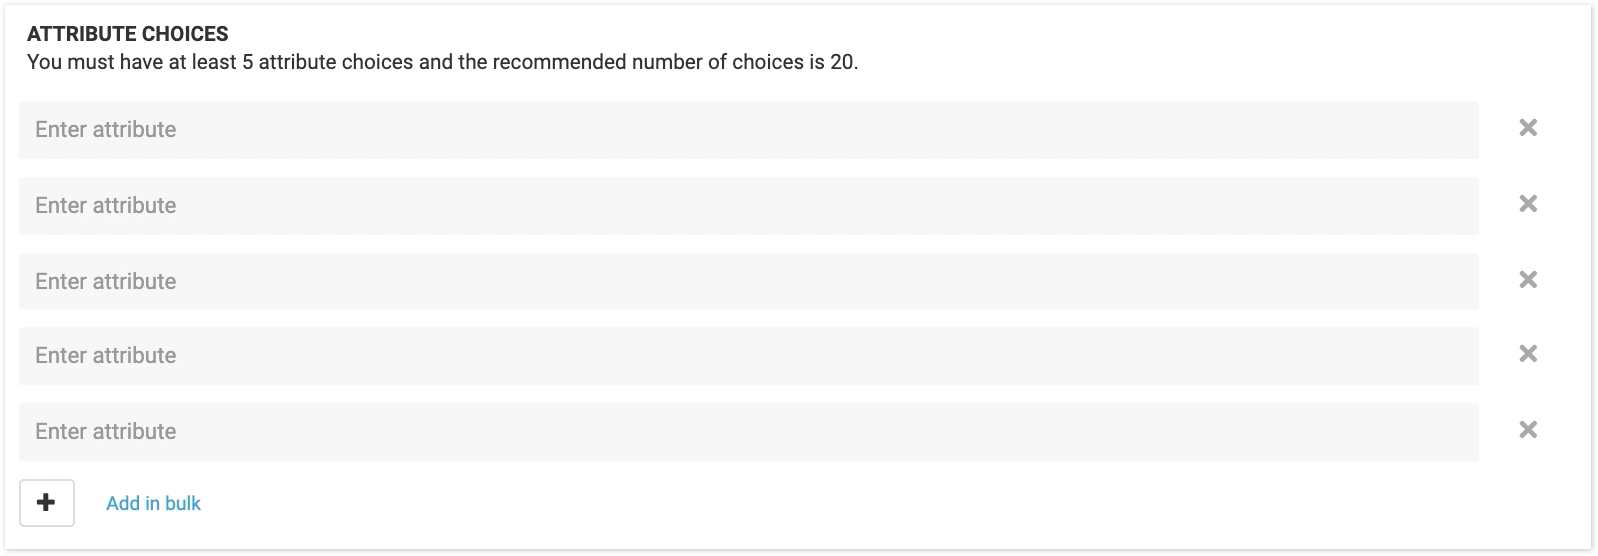
To delete an option as an attribute for this question, click the X to the right of the line for that specific option. Note: Deleting options will impact reporting. If you delete an option after a survey has launched, the respondent data will be deleted as well.

6. Enter each option individually per line or click Add in bulk to add multiple options. Enter or paste all options and click Add.

7. Select the Settings tab to define your survey logic, including the number of sets and attributes per set respondents will see. See Question Data Labels for details on the Data label field, including how this field is used in reports and downloads.
CheckMarket provides recommendations for these fields, and the values in these fields will be adjusted based on any changes you make.
Note: In general, Number of Sets is calculated based on the following equation:
(3 x Number of Attributes Per Set) / Number of Attributes Per Set
However, the Estimated Sample Size is used to provide different recommendations on the Number of Attributes Per Set and Number of Sets. For smaller sample sizes (<150), CheckMarket recommends using a multiplier of 1.25 (instead of 3) for greater accuracy. However, Number of Sets and Number of Attributes Per Set can be changed by the admin.

8. Click Save. The survey will appear in the survey editor where you can view all question sets and preview them before sending out to respondents. See “Experimental design” below for information on the logic used to determine what question sets will be sent to respondents. Note: The preview is randomly showing one example version that a respondent would see.
Select Settings in the options menu to configure survey appearance and various other elements, including survey language. Language support and translations for MaxDiff are available. Select Distribute to indicate how you would like to collect responses. Select Analyze to view respondent data in various formats, including in reports and through raw data.
Select Distribute, and Analyze in the options menu to continue configuring your survey.

Experimental design
For MaxDiff, experimental design determines which attributes will be shown in the questions presented to respondents. Additionally, it provides a complete balance in representation of the attributes to ensure accurate and reliable results across the correspondent pool.
CheckMarket recommends that every respondent sees each attribute three times. Additionally, CheckMarket experimental design takes into attribute balance, paired balance, and position balance:
- Attribute balance — Each attribute is shown an equal number of times within a respondent’s question set.
- Paired balance — Each attribute is shown with every other attribute an equal number of times.
- Position balance — Each attribute is shown in each position in the set an equal number of times.
Reports and downloads
Reporting element “MaxDiff Summary” is added by default to the Smart Report and can also be added to Blank Reports when you use MaxDiff in a survey. See Add a report element for additional details.
You can edit this view to include the Relative Importance metrics, Total counts of Most and Least important selections across respondents, and the Confidence intervals. When you change the data elements on the page, you can either export this report as an image or download the report details to view in an Excel spreadsheet.
You can also apply filters and recalculate report data, which will run the MaxDiff modeling and analysis based on the filter specified.

The MaxDiff details report shows the root likelihood for each respondent as well as experimental design and version details. Additionally, this report shows respondent selections based on the version made available to the respondent. This includes exporting respondent level metrics (utilities, relative importance) for use in analysis (e.g., segmentation).
The existing Respondent Report includes the MaxDiff respondent responses to the MaxDiff question sets.
You can download the raw data in CSV or XLS format to perform additional analysis if needed. See Download your results for details.
Leave a Reply