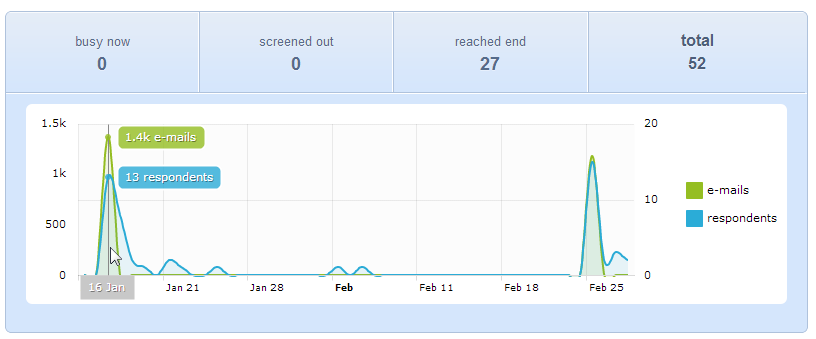
On the survey overview page, there is a chart that shows detailed information about your survey response rate.
Overview
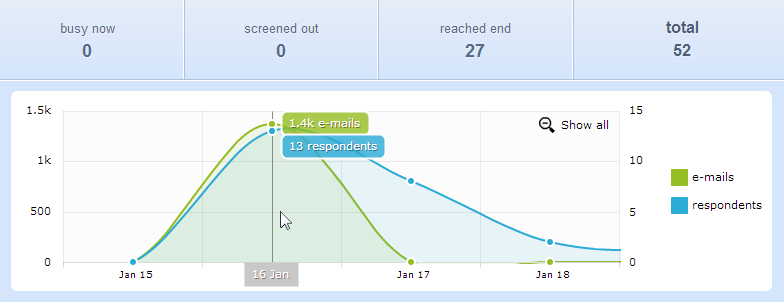
The chart shows you a timeline with the amount of emails sent and responses collected for each day your survey was live. Just hover over the chart to see the exact amount of emails or respondents.
Zoom in and out
You can zoom in and out to narrow down on the period you want to see. Just left click to set your starting point and drag to your end point.
Hide emails or respondents
You can hide for example the emails and only show respondents by selecting what you want to see on the right.


Leave a Reply