Analyze your survey results in Excel
With the clear and intuitive Excel reports you can dig deeper into your results. Analyze survey results with our Excel reports! Our tool generates a global overview, a cross-tab analysis or the raw survey data.
Survey results in Excel
Quick view
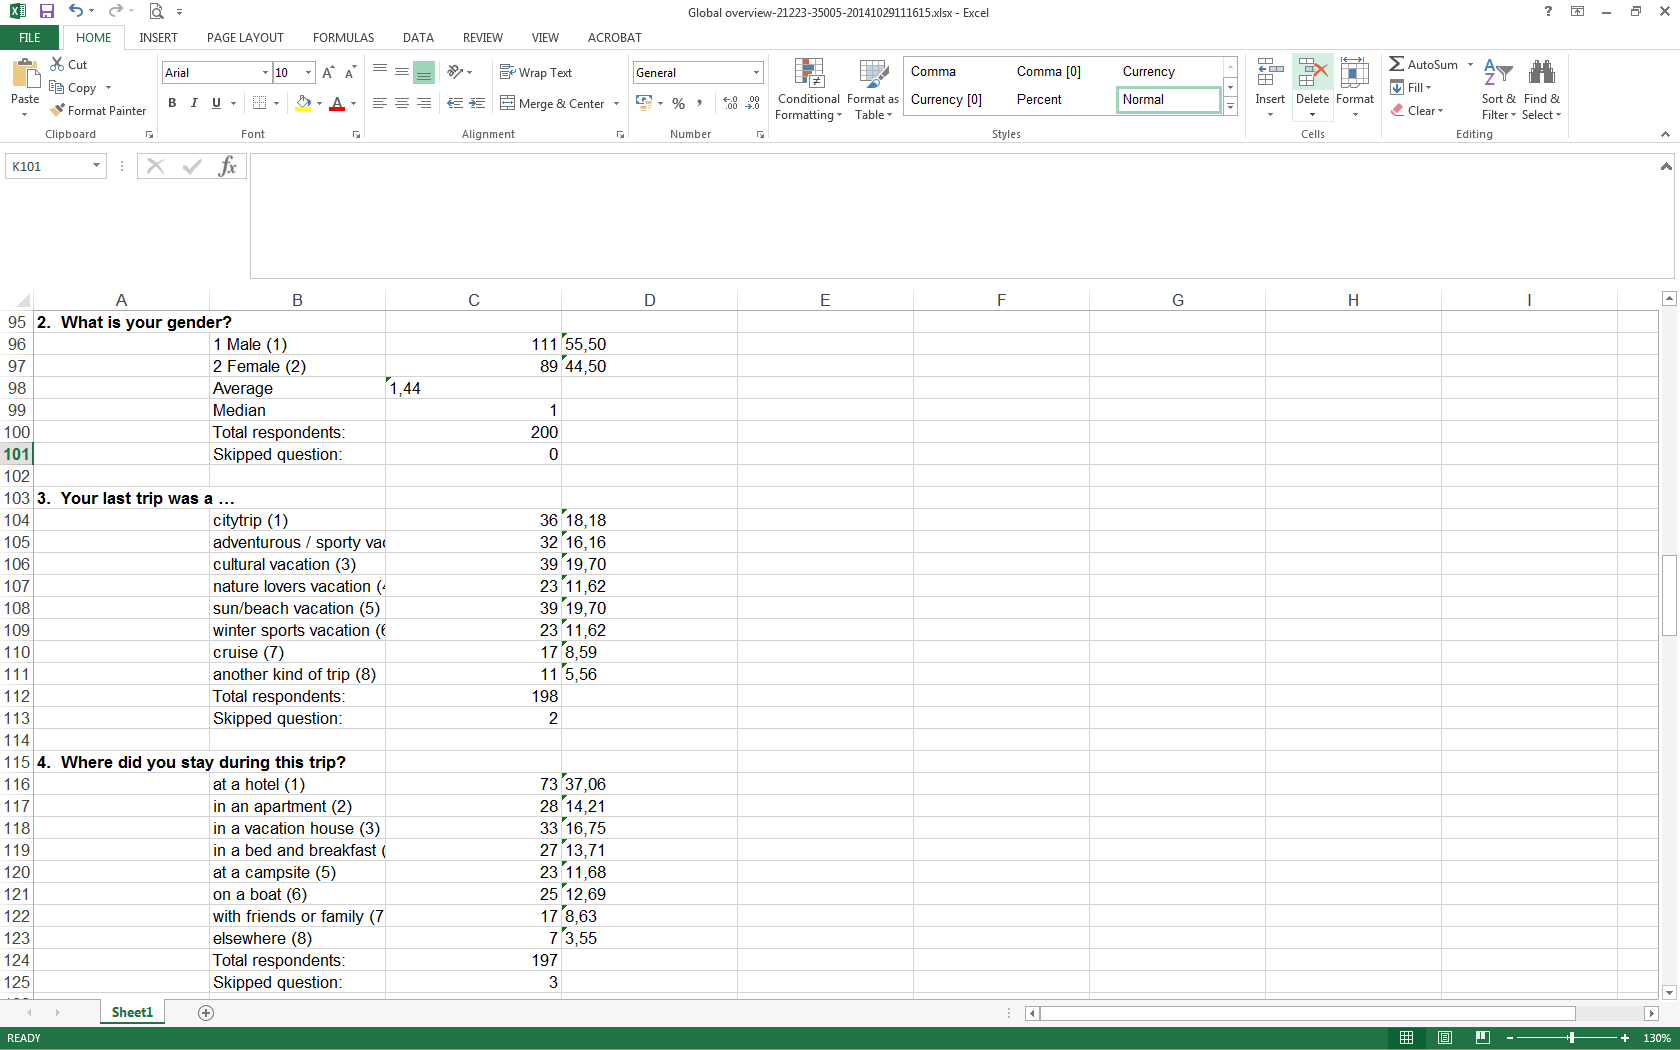
This file includes the general statistics and properties of the survey. Summary tables for each question provide frequency counts and response percentages for all the responses in the survey.
Cross-tab analysis
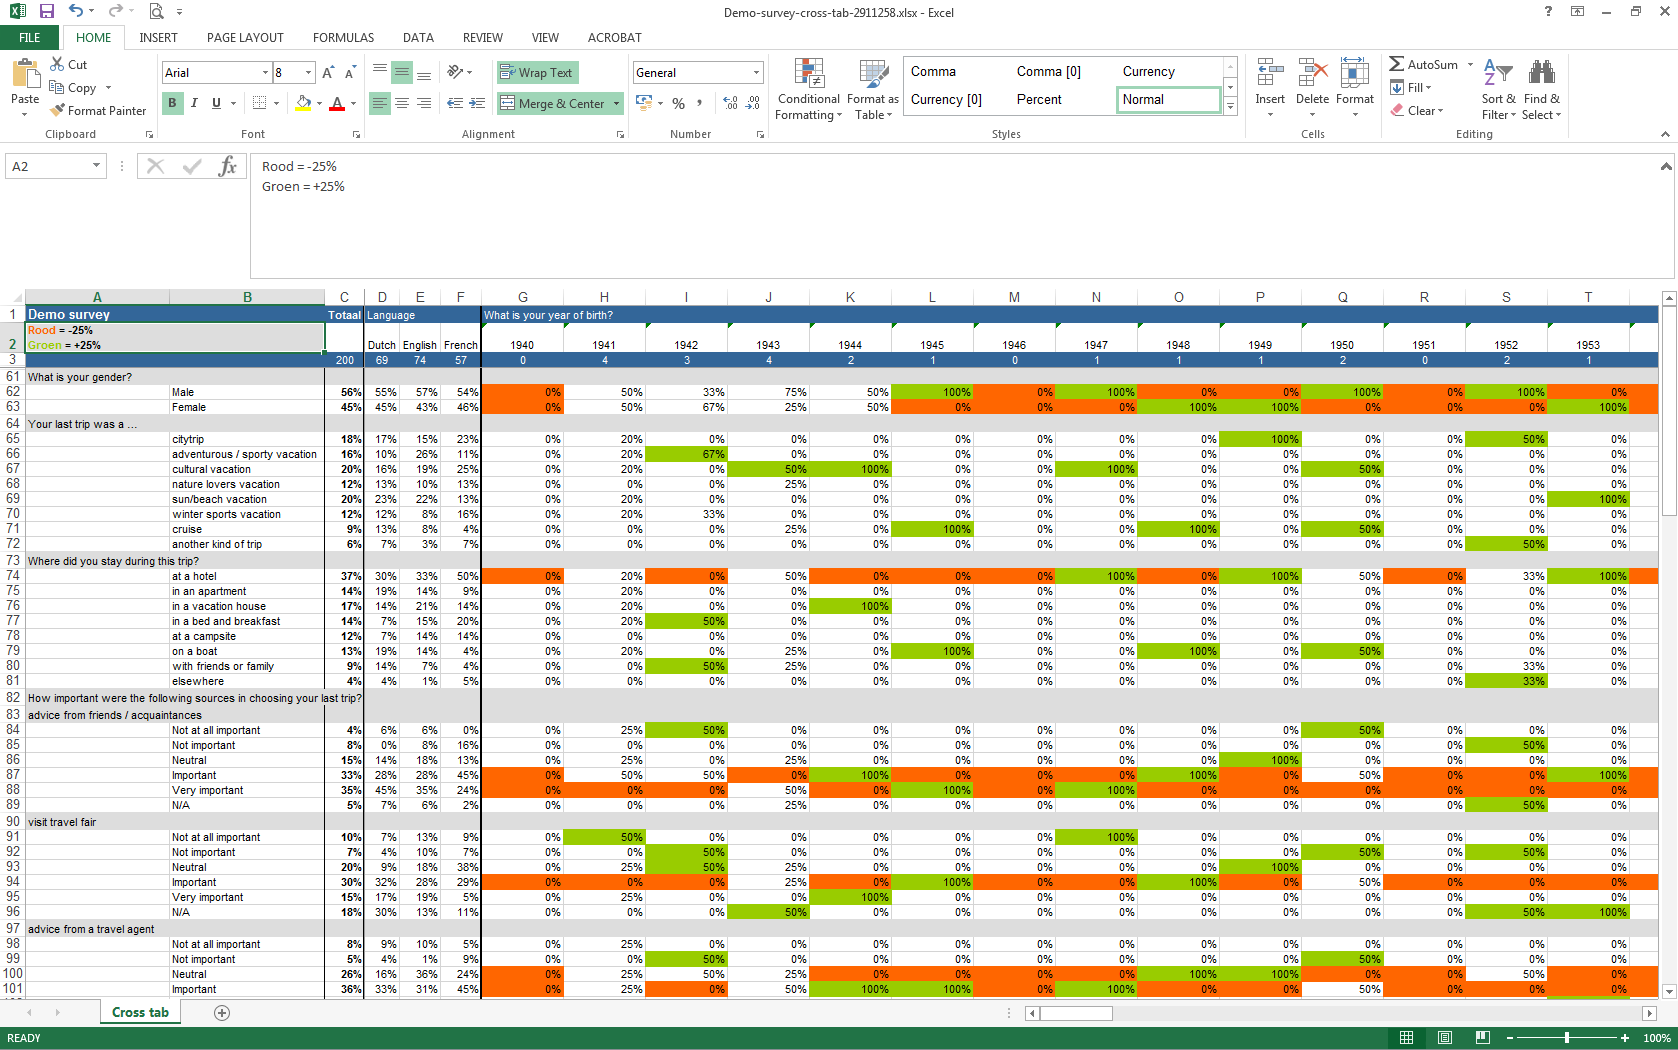
Cross-Tabulation is used to show relationships between responses given for two survey questions. The response options from survey questions are displayed in a table to the left (the row labels) of the table data as well as across the top of the table (the column headings). The percents indicate the number of survey responses that matched both the column heading choice and the row label choice. Cross tabulations are also known as contingency tables.
Raw data
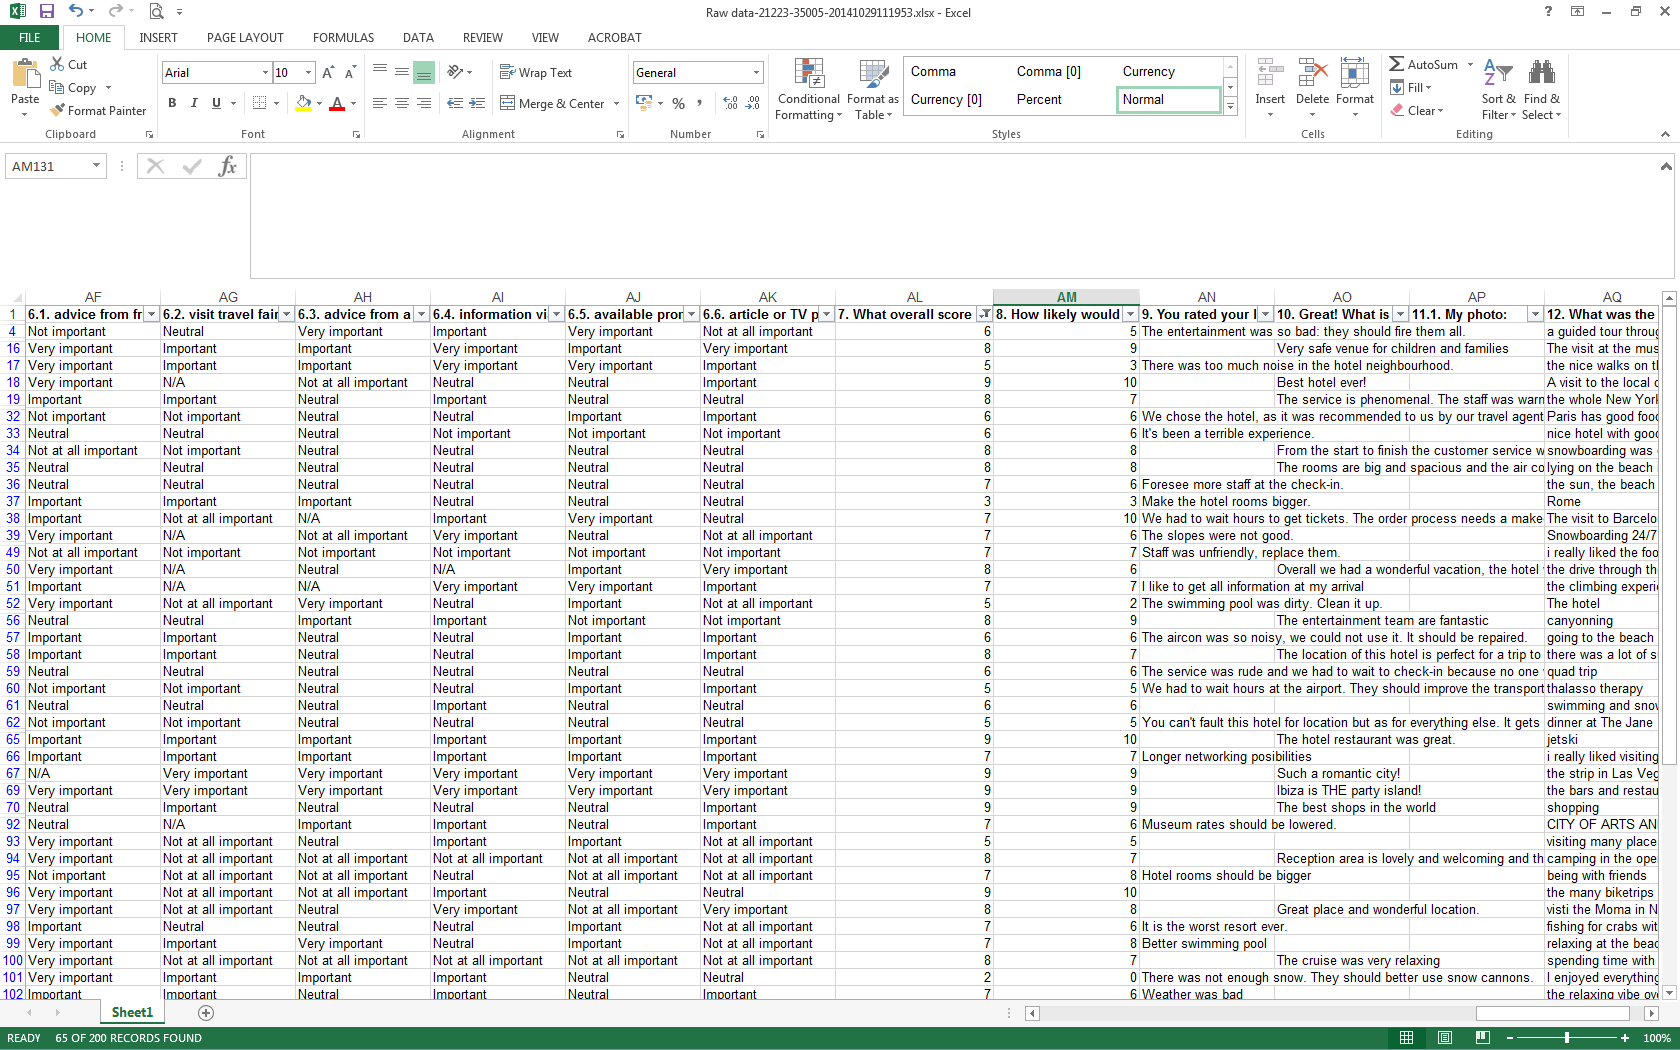
This is a table of all the respondents and their individual responses. Each respondent is listed on a separate row. The first few columns contain properties of the respondent and the rest of the columns contain the responses to each question in a separate column.
Download responses easily
You have different options when downloading your Word survey results:
- Choose type
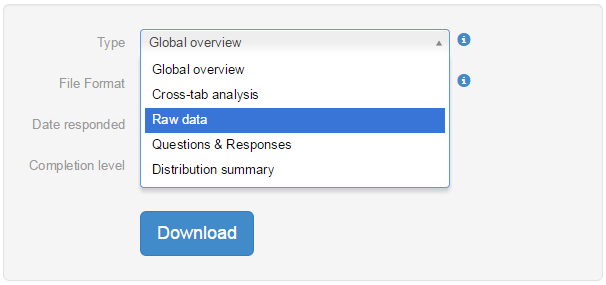
You can choose 3 types of Excel reports; quick view, a cross-tab analysis and a raw data report. - Choose time frame
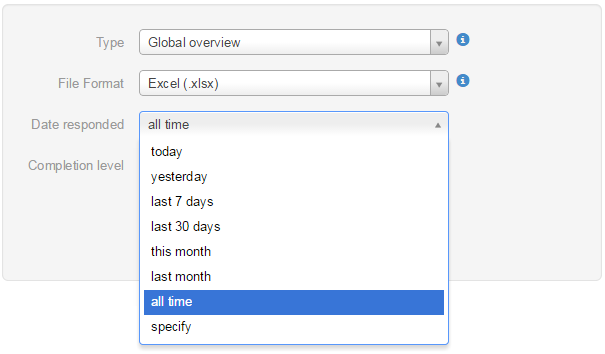
You can select the date responded: you can choose to include all of the responses or only responses given during a certain period. - Choose a completion level
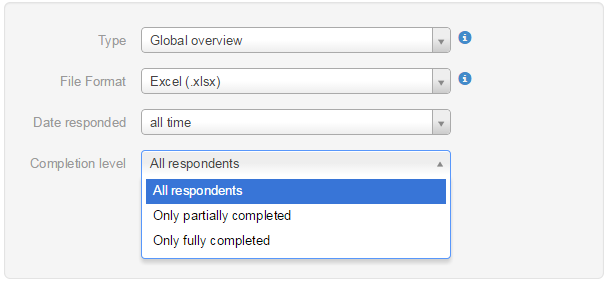
You can choose to download all respondents’ responses or only the responses of those who have completely filled out your survey.
Create your own surveys with Excel survey results
Just give it a try. Register for free, create and launch your survey and use the results afterwards in Excel.
